Google bought Urchin and now we have Google Analytics, a great free website statistics service. Here are some screenshots of what's inside it.
I used some of my websites to test Google’s new service – Google Analytics – which was officially launched on November 14th. At that time, right after registering I had problems with logging in and then the service was down for a couple of hours. Aside from this little problems on the first day of the service, everything else worked great. And notice no “BETA” in the logo, since they just bought Urchin and adapted for their servers.
Here’s the home page, right after you log in:
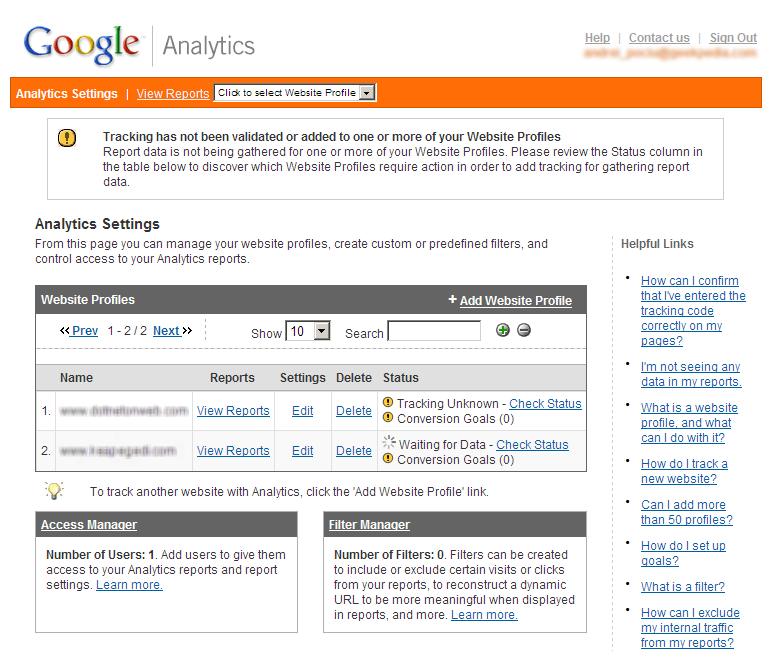
You put the code in the website right before the closing head tag (</head>) and in 5 hours or so you can see the first statistics. That’s right, the tracking is not done in real-time, unfortunately.
No button, banner or any ad type is displayed on your page when you use the JavaScript from Google Analytics, unlike the other free stats services.
The first thing you see when clicking on View Reports is the Executive Overview, which is identical to the Marketer Overview and Webmaster Overview.
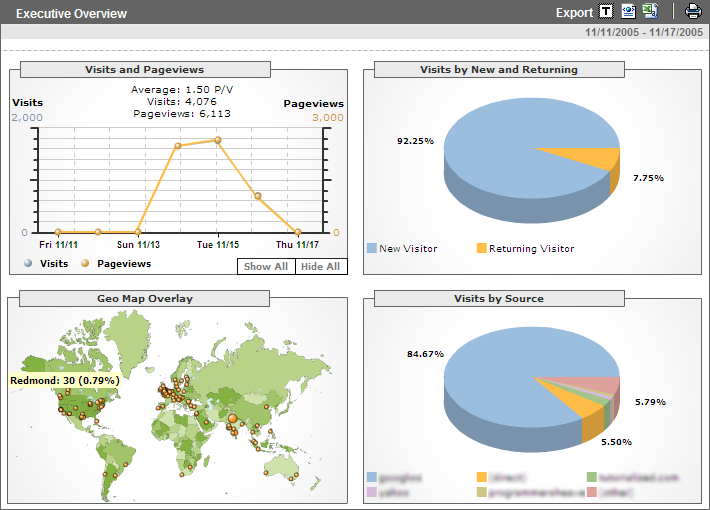
As you can see, on the top you have the posibility to export in a tab separated file, XML file or Excel. There’s also a link to the printer-friendly version of the page. This features are available on most of the pages.
If you’re curious how the charts are made, and the map – it uses Macromedia Flash.
Browser versions of your visitors are detected using the user-agent string.
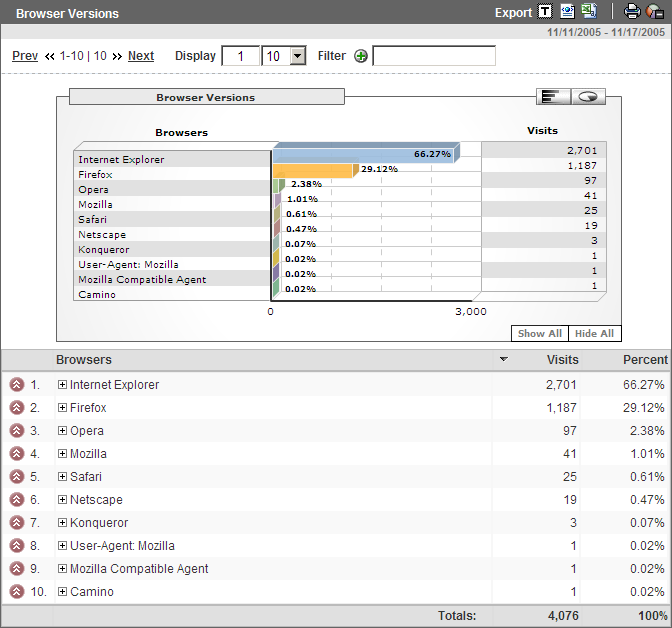
Clicking the + button next to each browser type shows you the actual versions of that browser (such as Internet Explorer 6.0 – 89%, Internet Explorer 7.0 -11%).
Also, using the user-agent, the script is capable of detecting the visitor’s operating system:
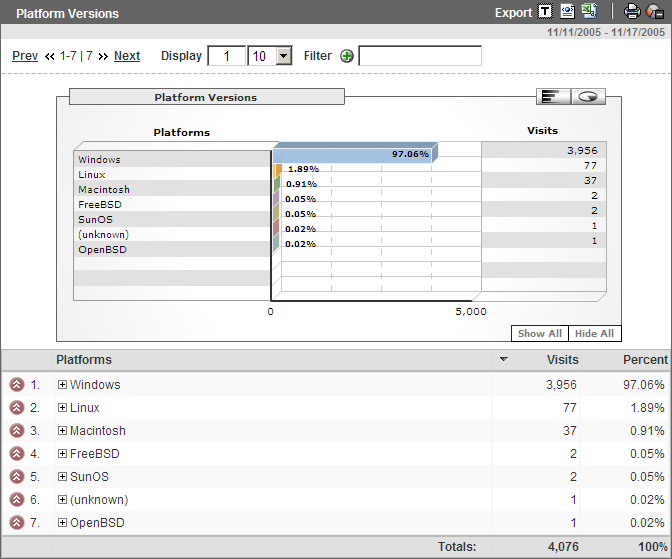
Just like in the browser statistics, by clicking the + button we see statistics for several versions of the selected operating system (such as Windows Vista, Windows XP, Windows Server 2003, etc.).
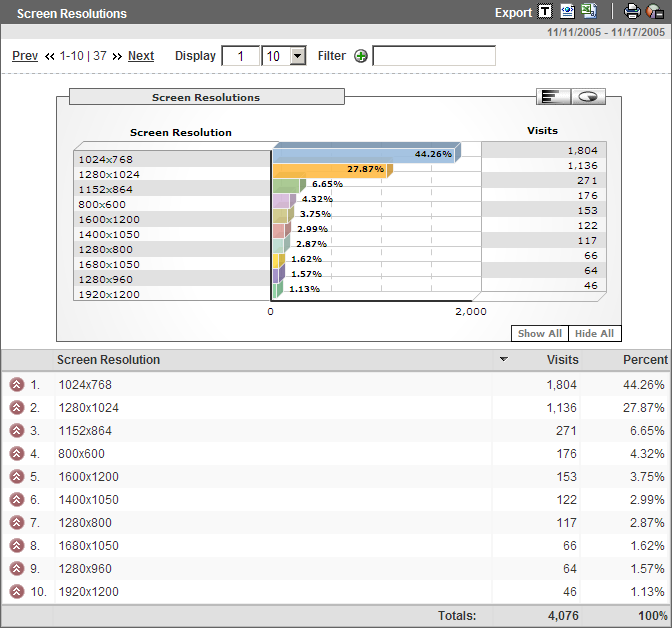
Screen resolutions is also an interesting statistic for your website, helping you decide your new layout:
There are many, many more pages providing statistics for your website but which we’re not going to mention here. You can check them out yourself by logging in to your Google Analytics account at http://www.google.com/analytics.